 August 18, 2026 -
 19 minutes read


Key Takeaways
- Predictive analytics in manufacturing uses past and real-time operating information to forecast failures, defects, delays, yield changes and process deviations before they impact operations.
- The highest-value use cases relate a forecast to an action in maintenance, quality control, production, energy or planning.
- The machine learning model is equally important as reliable sensor data, contextually stored MES/ERP/SCADA records, domain expertise, and workflow integration.
- Manufacturers should keep track of false alarms, missed events, prediction lead time, downtimes avoided, scrap reduced, and financial impact, not just accuracy.
- The best option is to tackle one high-value, recurring, predictable and actionable problem instead of rolling out AI for the entire plant.
- Production models must be continually monitored because equipment, sensors, materials, products, recipes and operating conditions are subject to change over time.
The beauty of predictive analytics in manufacturing is that it provides teams with a practical advantage that is time. Using historical information and real time factory data, teams can make a prediction of what should occur next and take action before an expensive failure, defect, bottleneck or process deviation occurs.
According to Deloitte's Manufacturing Industry Outlook 2026 survey, approximately 80% of manufacturing executives said they intend to allocate 20% or more of their improvement budget to smart manufacturing initiatives involving analytics, sensors, automation and cloud-based technologies.
This guide covers where predictive systems add value, how factory data can be used as an operational prediction, what technologies are needed, how to develop a production-ready predictive solution, how to calculate ROI, and when simpler analytics might be a better option.
What Is Predictive Analytics in Manufacturing?
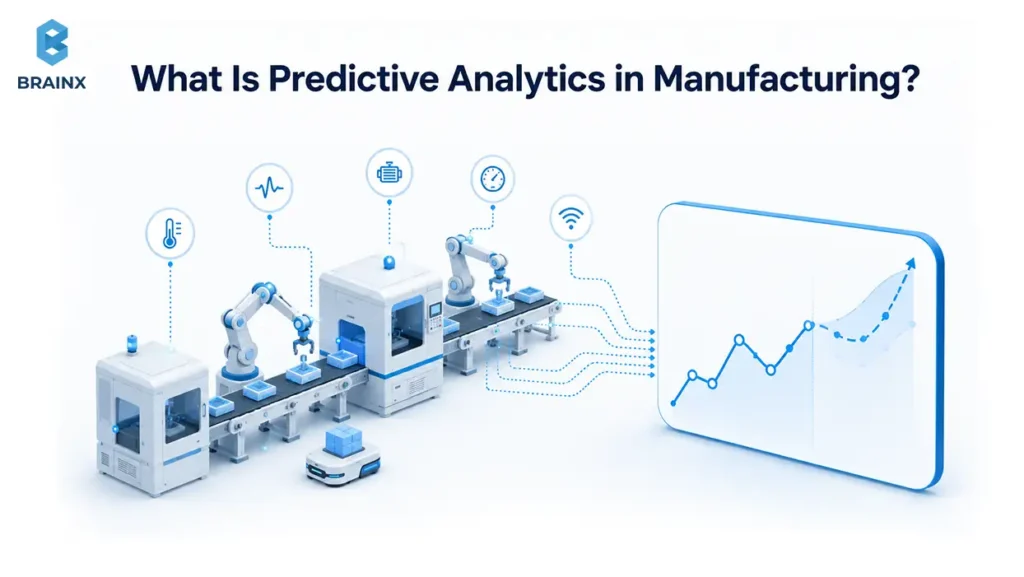
Predictive analytics in manufacturing leverages statistical techniques, machine learning, operational data and domain expertise to predict future equipment, quality, production or process performance. The goal is not merely to detect what is happening now; it is to create enough warning for a person or system to change what happens next.
A model could predict that a bearing is more likely to fail in the next few working days, that a batch is trending towards failing to meet a specification or that a work centre is expected to fail to achieve the cycle time. The 2026 smart-manufacturing roadmap from NIST highlights the need for industrial AI to operate across heterogeneous data, sensing, control, and legacy environments while being trustworthy and reliable.
Predictive Analytics vs. Traditional Manufacturing Analytics
| Analytics Type | Core Question | Manufacturing Example |
| Descriptive | What happened? | Line 4 recorded 78% OEE yesterday. |
| Diagnostic | Why did it happen? | OEE fell because of repeated conveyor stoppages. |
| Predictive | What is likely to happen? | Drive-failure risk may cross the intervention threshold within 48 operating hours. |
| Prescriptive | What should we do? | Inspect the drive during the next planned changeover and reduce load until maintenance is complete. |
A live dashboard can be sophisticated without being predictive. Likewise, a fixed temperature alarm is still a deterministic rule. Predictive systems learn relationships between operating conditions and future outcomes, then use these relationships to make predictions with current data.
What Can Predictive Systems Actually Forecast on the Factory Floor?
Depending on the use case and data, models can estimate failure probability, remaining useful life, defect probability, cycle-time deviation, process instability, yield, resource demand, abnormal energy consumption, or bottleneck risk. The useful output is a forecast tied to a decision horizon—not a generic “AI score.”
For a rotating asset, vibration may still sit below a fixed alarm threshold while its spectral pattern changes gradually. A predictive model can combine that shift with temperature, load, speed, and maintenance history to raise risk earlier than a hard limit would.
Why Are Manufacturers Investing in Predictive Capabilities Now?
Manufacturers are investing as connected operations are delivering more usable data and earlier decisions are becoming more valuable due to downtime, quality, labor and utilization pressures. The business case is strongest where advance warning changes a costly operational outcome.
In Deloitte’s 2025 Smart Manufacturing and Operations Survey, 92% of 600 executives said smart manufacturing would be a primary driver of competitiveness over the next three years. The same study revealed that 78% are spending more than 20% of all their improvement funds on smart-manufacturing projects.
Connected Equipment Is Creating More Usable Operational Data
Modern plants can combine sensor telemetry, PLC and SCADA values, machine historians, MES events, maintenance records, quality systems, and ERP context. Among the manufacturers surveyed, Deloitte found that facility-level or network-level use of data analytics and cloud computing stood at 57%, while IIoT use stood at 46%.
Where deeper connectivity is required, BrainX’s enterprise IoT solutions guide explains the architecture behind connected equipment, gateways, data flows, and enterprise integration.
Downtime, Quality, Labor, and Efficiency Pressures Increase the Value of Foresight
Prediction becomes valuable when waiting costs more than acting early. Rockwell Automation’s 2025 State of Smart Manufacturing found that 95% of surveyed manufacturers had invested in or planned to invest in AI/ML within five years, while 50% planned AI/ML use for product quality in 2025.
EXPERT PERSPECTIVE
“With the right technology and right people, we can simplify complexity and lead with confidence during times of dynamic change.” — Blake Moret, Chairman and CEO, Rockwell Automation
Predictive Analytics in Manufacturing Industry Operations: Where It Creates Value
Predictive analytics in manufacturing industry operations creates the most value when three conditions overlap: the future event has material business impact, the available data contains an early signal, and the plant can take a useful action before the event becomes costly. Maintenance, quality, throughput, yield, and energy therefore tend to be stronger candidates than outcomes that are effectively random or unactionable.
Deloitte respondents reported average net improvements of about 10–20% in production output, 7–20% in employee productivity, and 10–15% in unlocked capacity after broader smart-manufacturing implementations. These are smart-manufacturing results, not guaranteed predictive-analytics returns.
How Does Factory Data Become an Actionable Prediction?
For predictive analytics in manufacturing, an actionable prediction is the result of an operating loop: capture data, add context, train and validate model, run inference, deliver result to a workflow, record result, monitor performance over time. The model is only one component of that system.
How Predictive Analytics in Manufacturing Turns Factory Data Into Decisions
- Data capture: sensors, machines, OT applications, and enterprise systems record relevant signals.
- Data ingestion: batch or streaming pipelines move records into an analytics environment.
- Cleaning and contextualization: timestamps, asset IDs, products, recipes, shifts, and work orders are aligned.
- Feature engineering: raw measurements become variables that represent degradation, load, variability, or process state.
- Model training and validation: models learn patterns and are tested on unseen data and realistic operating conditions.
- Inference: the production model generates a forecast, probability, anomaly score, or remaining-life estimate.
- Operational action: a person or system responds through an inspection, work order, process change, or planning decision.
- Outcome feedback and monitoring: the actual result is recorded so drift, false alarms, missed events, and retraining needs can be tracked.
What Data Sources Feed Manufacturing Predictions?
Predictive analytics data for manufacturing can be sourced from IIoT sensors, PLCs, MES, ERP, SCADA, historians, CMMS/EAM platforms, quality-management systems, operator logs, production recipes and work-order history. Chances of success for a production model with just a stream of raw data are limited because the same signal could have different meanings under varying loads, products, recipes, and/or machine states.
How Do Predictions Reach Maintenance and Production Workflows?
A risk score creates no financial benefit until it reaches someone who can respond. Depending on the use case, predictions can trigger dashboard alerts, operator notifications, CMMS inspection requests, maintenance work orders, production-rescheduling suggestions, set-point reviews, or human approval steps. Confidence information, context and clear escalation rules should be included in high impact actions.
What Benefits Can Manufacturers Expect From Predictive Analytics?

For predictive analytics in manufacturing, the best value model is application → operational effect → plant KPI → financial consequence. A generic claim that “AI improves efficiency” is not enough; the predicted event and resulting action should connect to a measurable plant outcome.
Reduce Unplanned Downtime and Maintenance Waste
Earlier warning can move selected assets from reactive or rigid calendar-based maintenance toward condition- and risk-based intervention. In a 2025 case study, Siemens reported that BlueScope avoided about 2,000 hours of unplanned downtime across three years and prevented 53 complete process interruptions using Senseye predictive maintenance.
Note: Those results are specific to BlueScope and are not an industry standard.
Improve Product Quality and Reduce Scrap
Quality models can identify combinations of equipment state, material properties, process parameters, and environmental conditions associated with higher defect probability. The greatest value is obtained when the warning is received in time to stop the process or isolate the affected material before further value is added.
Increase Throughput and Asset Utilization
Capacity is lost due to failures, micro-stoppages, slow cycles and unstable processes. Forecasting these conditions can support earlier maintenance, resequencing, or load balancing, connecting model performance to throughput, OEE, schedule adherence, and availability.
Improve Yield and Process Consistency
Yield prediction is helpful in situations where outcome depends on a large number of interacting variables. The combination of temperature, pressure, flow, dwell time, material grade, the condition of the tools, or recipe settings can be used to detect poor operating patterns before the process becomes irreparable.
Reduce Energy and Resource Waste
Models can predict what electricity, steam, gas, compressed air, water or other resources are expected to be consumed for a particular production state and can identify significant deviations. Using plant-specific consumption and cost data, teams can then research the impact of abnormal loads, leaks, inefficient operating modes or equipment degradation.
Support Faster, More Confident Operational Decisions
Prediction is best treated as decision support. Quality engineers can work on the most defect-inducing process conditions, while reliability teams can concentrate on the assets that have the highest modeled risk. The system narrows attention, while engineering judgment determines the response.
Where Does Predictive Analytics Create the Most Manufacturing Value?
The strongest use cases of predictive analytics in manufacturing have a valuable outcome, observable precursors, and enough prediction lead time to act. Six applications cover much of the practical factory-floor opportunity.
Predict Equipment Failure and Remaining Useful Life
Predictive-maintenance models analyze degradation data like vibration, temperature, acoustics, pressure, current, lubricant condition, and operating history. Outputs can include failure probability, anomaly score, degradation state, or remaining useful life.
Predict Defects Before Final Quality Inspection
Predictive quality combines known quality outcomes with machine settings, materials, tool condition, environmental readings, dimensional measurements, or vision features. The objective is to estimate defect risk early enough for corrective action rather than simply automate final inspection.
Forecast Bottlenecks, Cycle Times, and Production Delays
Models can estimate which work center, queue, machine condition, changeover, or process step is likely to constrain future output. The prediction horizon must match the decision window: an accurate alert that arrives after scheduling choices are locked has little operational value.
Predict Yield and Process Deviations
Process manufacturers can combine recipe and process variables; discrete manufacturers may combine tool wear, torque, fixture condition, machine settings, and component variation. Predictive modeling can complement statistical process control by estimating eventual outcomes from earlier process conditions.
Forecast Energy and Resource Consumption
Factories can forecast expected consumption by asset, product, shift, or production schedule. Deviations from the expected profile can support peak-load planning and reveal conditions worth investigating for inefficiency or degradation.
Improve Material and Inventory Decisions Without Duplicating Supply-Chain Coverage
Short-horizon production forecasts can improve line-side material planning by anticipating changes in output, cycle time, scrap, or yield. Broader demand, supplier, safety-stock, logistics, and ETA forecasting belongs to supply-chain analytics; BrainX covers those areas separately in its predictive analytics in supply chain guide.
A Predictive Analytics Example in Manufacturing: From Sensor Signal to Maintenance Action
A predictive analytics example in manufacturing can begin with a critical motor-driven bearing. Vibration, temperature, motor current, speed, and load are recorded continuously. The model detects a frequency-domain pattern that differs from the healthy baseline even though temperature remains below the conventional alarm limit.
| Stage | What Happens |
| Signal | Vibration spectrum begins to deviate from the expected operating pattern. |
| Prediction | The model raises bearing-failure risk within the maintenance planning horizon. |
| Validation | A reliability engineer checks trend, load, confidence, and recent maintenance. |
| Action | The CMMS creates an inspection or planned work order. |
| Intervention | The bearing is serviced during a planned production window. |
| Learning | Inspection findings and actual condition are stored as feedback for future predictions. |
A real-world analogue comes from Bosch’s Blaichach smart-factory case. Bosch says Nexeed reads data from more than 60,000 sensors, and predictive maintenance helped reduce disruptions in ESP manufacturing at the plant by about 25%.
What Technology Stack Does a Predictive Manufacturing System Need?
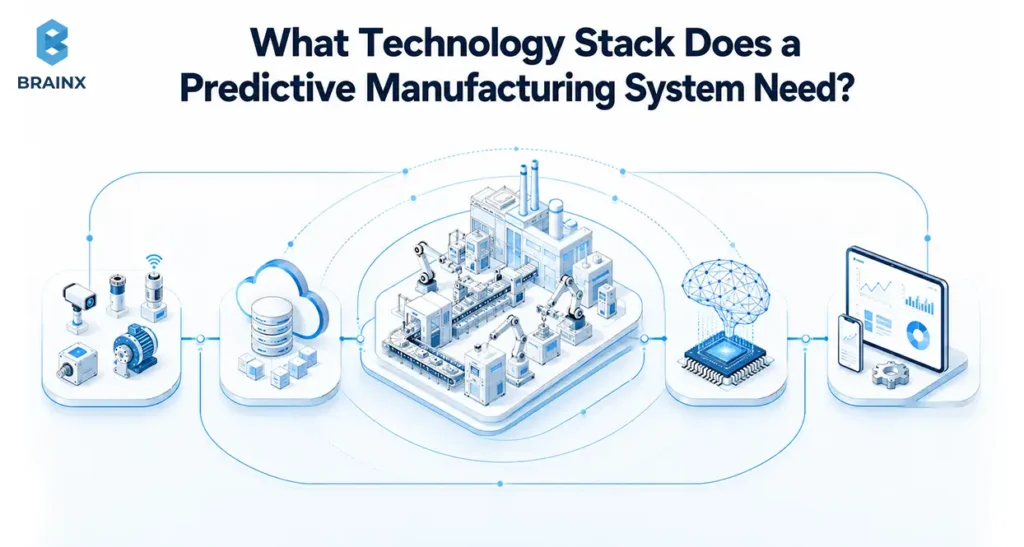
A system, which is production-ready for predictive analytics in manufacturing, needs instrumentation, operational context, data infrastructure, models, deployment infrastructure, and workflow integrations working as one architecture. The right design depends on latency, scale, availability, security, and the operational decision being supported.
Sensors and IIoT Capture Operational Signals
Some useful measurements are vibration, temperature, pressure, acoustics, current, voltage, speed, torque, flow, humidity, and environment. For other use cases, additional instrumentation is needed, while many PLCs already expose enough data. New sensors should be justified by the prediction they enable.
MES, ERP, SCADA, Historians, and CMMS Add Operational Context
Sensor readings become more useful when connected to machine state, product, recipe, batch, work order, maintenance history, and quality outcome. For the broader IT/OT integration and resilience layer, see BrainX’s IT services for manufacturing guide.
Machine Learning and AI Models Detect Patterns and Forecast Outcomes
Regression can estimate continuous outcomes such as yield or remaining life. Classification can estimate failure or defect probability. Time-series models predict a variable over time. Anomaly detection is used to detect when the behavior strays from what is normal. Computer vision can add inspection features. The use case should determine the sophistication of the model and not the other way around.
Edge, Cloud, and Hybrid Architectures Support Different Production Needs
Edge inference is suitable for low latency, intermittent connectivity, bandwidth sensitive, or data control use cases. Cloud platforms make centralized training, storage, fleet analytics and multi-site management easy. Hybrid architectures are a mix of local inference with centralized model management and monitoring.
Dashboards, APIs, and Workflow Integrations Turn Predictions Into Action
The application layer links the model output to MES, CMMS, ERP, engineering dashboard, operator interfaces, etc. Users might require the following information about the asset, the expected event, the time frame, the level of confidence, the contributing signals, recommended inspection, and the escalation path, in addition to a probability score.
When Is Predictive Analytics the Wrong Solution?
Predictive analytics in manufacturing is not the right answer for every factory problem. Dashboards, engineering limits, statistical methods, or anomaly detection can be cheaper, easier to validate, and easier for operators to trust. The right method follows the problem structure.
Use Dashboards When the Problem Is Visibility
If managers only require up-to-date information on downtime, WIP, output, energy or quality, then descriptive analytics might be the answer. Adding prediction before reliable visibility exists creates unnecessary complexity.
Use Rules or Threshold Alerts When Failure Conditions Are Already Known
A deterministic rule, such as a process that needs to be stopped above a certain pressure or temperature, is more clear and secure than an ML model trying to infer the same condition when engineering limits are validated.
Use Anomaly Detection When Failure Labels Are Scarce
Supervised prediction needs trustworthy examples of the outcome being learned. Industrial failures may be intentionally rare or inconsistently labeled. In such situations, anomaly detection can learn what is normal and report on anomalous conditions without assuming to know a specific future failure mode.
Use Predictive Models When Future Outcomes Can Be Learned and Acted On
A strong candidate is one that has data from the past, recurring patterns that could be precursors, a useful prediction period, and a potential intervention that can be made. A statistically correct warning that arrives too late for maintenance or process action is operationally useless.
Move Toward Prescriptive Analytics Only When Decisions Can Be Safely Optimized
Prescriptive analytics recommends what to do next. That adds safety, control, explainability, and governance requirements. High impact decisions should continue to be backed up by human control and safeguard mechanisms while the organization lacks confidence in the automated recommendations.
How Should Manufacturers Implement Predictive Analytics?
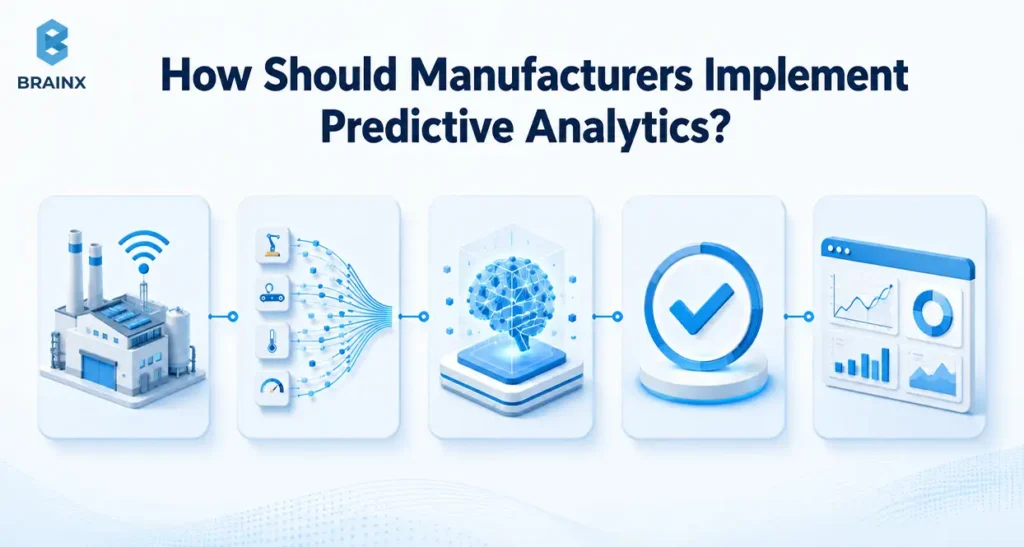
Manufacturers need to adopt predictive analytics in manufacturing through a narrow and measurable production use case first, and then look at line-wide or plant-wide scale up. A disciplined roadmap minimizes the risk of building an accurate model that contains no useful data, integration or business impact.
Step 1 — Choose One Expensive, Predictable, and Actionable Problem
Rank candidates by financial impact, event frequency, data availability, prediction feasibility, and ability to intervene. “Reduce downtime” is too broad; “predict bearing degradation on five constrained motors with enough warning for planned maintenance” is testable.
Step 2 — Audit Data Availability, Quality, Labels, and Coverage
Check missing readings, sensor health, timestamp alignment, failure labels, maintenance records, class imbalance, and coverage across products and operating states. Data readiness should be assessed before committing to a production timeline.
Step 3 — Establish Baselines and Business Success Metrics
Define one model metric and one operational metric before modeling begins. For example, recall at an acceptable false-alarm rate may be the model target, while bearing-related unplanned downtime is the operational target.
Step 4 — Build a Narrow Proof of Concept
Limit the PoC to one machine family, line, failure mode, or quality problem. The goal is to prove predictive signal and operational usefulness. BrainX’s AI development services follow a similar path from problem identification and data preparation through PoC, integration, deployment, and monitoring.
Step 5 — Validate Predictions Under Real Operating Conditions
Test across shifts, loads, product variants, recipes, material lots, environmental conditions, machine age, and maintenance states. Models that learn one narrow regime can fail when production changes.
Step 6 — Integrate Predictions Into Existing Workflows
Make a decision as to who receives each prediction and what they can do about it. Possible destinations include CMMS work orders, MES alerts, ERP planning workflows, dashboards, mobile notifications, or operator interfaces.
Step 7 — Deploy With Human Escalation and Fail-Safe Rules
Define confidence thresholds, human review, escalation levels, fallback logic, rollback conditions, and behavior when sensors, networks, or downstream systems are unavailable. Safety should never depend on a model being online.
Step 8 — Monitor Drift, Retrain, and Expand Carefully
Monitor data drift, model performance, false alarms, missed events, confidence, and intervention effectiveness. NIST’s 2026 roadmap emphasizes lifecycle reliability and the challenges created by changing industrial data and operating conditions. Expand only after the first use case remains stable under production variability.
How Should Manufacturers Measure ROI and Model Performance?
Manufacturers should evaluate predictive analytics in manufacturing across three linked layers: model performance, operational performance, and financial impact. A strong ROC curve is meaningless unless the prediction is timely, changes a decision and enhances a plant KPI.
Track Equipment Reliability and Maintenance KPIs
Useful maintenance measures are unplanned downtime, MTBF, MTTR (if applicable), asset availability, emergency work orders, maintenance labor cost, maintenance parts cost, and planned versus reactive work.
Track Production and Quality KPIs
Production and quality use cases may be measured through OEE, throughput, cycle time, first-pass yield, scrap, rework, final yield, schedule adherence, and process stability. Select the KPI that the intervention has a reasonable chance of influencing.
Measure Model Performance Beyond Accuracy
Rare-event accuracy can be misleading. If only 50 of 10,000 operating intervals contain a true failure precursor, a model that always predicts “healthy” is 99.5% accurate and still catches nothing. Track precision, recall, false-positive rate, false-negative rate, forecast error, calibration, confidence, and prediction lead time.
Connect Model Performance to Financial ROI
Translate model outcomes into avoided downtime, lower scrap and rework, reduced emergency repair cost, productive capacity, and energy/resource savings, then subtract data, infrastructure, development, integration, and operating costs.
ILLUSTRATIVE ROI SCENARIO — NOT AN INDUSTRY BENCHMARK
10 avoided downtime hours × $18,000/hour = $180,000
Reduced scrap/rework = $45,000
Avoided emergency repair cost = $30,000
Energy/resource savings = $15,000
Gross annual benefit = $270,000
Annualized implementation + operating cost = $150,000
Net annual impact = $120,000
Simple annual ROI = 80%
What Challenges Can Derail Predictive Analytics Adoption?
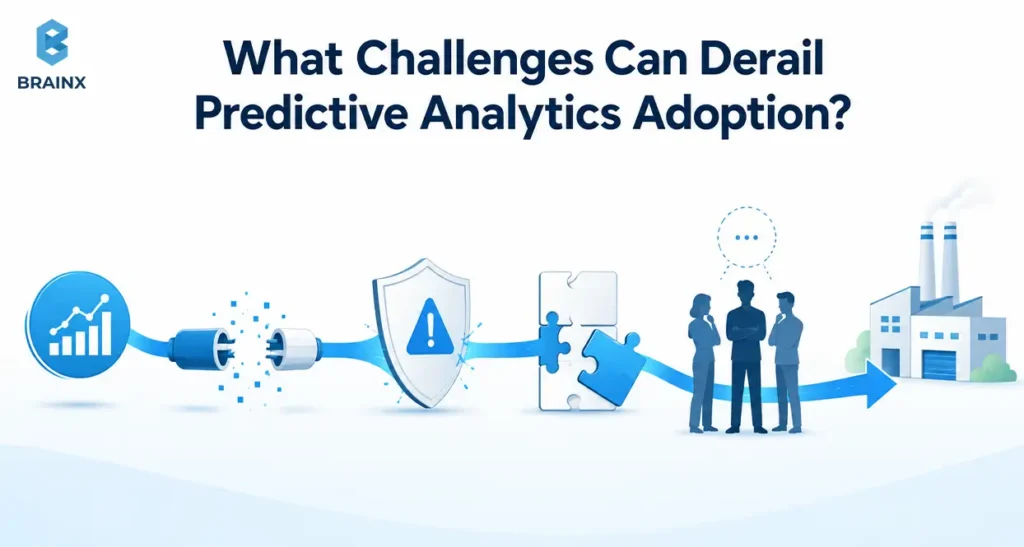
The usual reason for predictive analytics in manufacturing to fail is not because of the absence of algorithms. They occur when data quality, integrations, response processes, security, or lifecycle management cannot support the prediction reliably in production.
Poor Data Quality and Too Few Reliable Failure Labels
Missing readings, unsynchronized timestamps, incomplete work orders, incorrect failure codes, and very few historical failures weaken supervised learning. Start with a data-readiness audit and reconcile labels with maintenance and process experts.
Sensor and Model Drift Can Reduce Reliability Over Time
Replacement sensors, rebuilt machines, new materials, new recipes, and seasonal conditions can change input distributions or the relationship between inputs and outcomes. Monitor performance by operating regime and define retraining triggers.
False Alarms and Missed Failures Can Destroy Operator Trust
Too many unnecessary inspections create alarm fatigue; a missed high-impact event can damage confidence even faster. Set thresholds using the relative operational cost of false positives and false negatives, and record operator feedback.
Legacy Equipment and Fragmented OT/IT Systems Complicate Integration
Older machines might give away proprietary protocols, tags that vary from one machine to another, incomplete timestamps, or no digital interface. A stable data abstraction layer and common asset/context model can prevent every model from becoming a one-off integration project.
OT Cybersecurity and Data Governance Cannot Be an Afterthought
Connecting operational equipment to analytics expands the security responsibility of the architecture. According to NIST SP 800-82 Rev. 3, OT security should also consider unique performance, reliability and safety requirements. Implement appropriate segmentation, identity and access controls, secure interfaces, monitoring, change management, and recovery processes for the plant.
Predictions Fail When Nobody Owns the Response
A useful alert still fails if no one owns it, no inspection procedure exists, or maintenance cannot act. Define the alert owner, response SLA, decision authority, escalation path, and how the actual outcome returns to the model-management process before go-live.
What Determines Implementation Cost and Timeline?
The cost and timeline of predictive analytics in manufacturing are determined mainly by instrumentation, data readiness, integration complexity, scope, availability requirements, and deployment environment. Generic project-price ranges are rarely useful because superficially similar use cases can require very different engineering effort.
Existing Sensors and Data Readiness
Projects move faster when relevant signals are already collected at the right frequency, synchronized, retained historically, and linked to trustworthy event labels. New sensors, gateways, historian work, or long data-collection periods increase effort.
Number of Assets, Failure Modes, and Processes in Scope
Predicting one known failure mode across similar machines is very different from covering multiple equipment families and dozens of failure modes. Each new asset family can introduce different baselines, sensors, maintenance practices, and validation requirements.
Historical Data Preparation and Labeling Requirements
Data engineering may include resampling, timestamp reconciliation, tag mapping, event matching, outlier review, and domain validation. The time required depends on how consistently the plant has captured operating and maintenance history.
MES, ERP, SCADA, and CMMS Integration Complexity
A notebook model is cheaper than a production workflow. Live deployments may require authenticated APIs, event processing, historian access, CMMS work-order creation, identity management, logging, and resilient handling of unavailable systems.
Edge, Cloud, Security, and Availability Requirements
Low-latency edge inference, on-premises constraints, redundancy, multi-network connectivity, cybersecurity review, high availability, and disaster recovery add engineering requirements. These should be defined from plant needs before architecture is finalized.
Pilot, Single-Site, and Multi-Plant Deployment Scope
A narrow PoC may use one machine family and existing data. A production deployment adds live integrations, monitoring, versioning, security, and support.A multi-site rollout also requires uniform definitions of data, and the identification of equipment age, calibration, materials, and local operating practices.
What Best Practices Help a Pilot Scale to Production?
A predictive analytics in manufacturing PoC scales when the organization treats the model as an operational product with defined data standards, ownership, monitoring, and deployment practices. Scale proven value before adding model complexity.
Standardize Data and Feature Definitions Across Assets
Equivalent features should mean the same thing across assets and sites. Establish common units, timestamps, machine states, asset naming, and contextual definitions before expecting a model pipeline to replicate reliably.
Keep Engineers and Operators in the Feedback Loop
Operators and reliability teams observe conditions that datasets may miss. Record false alarms, missed events, findings in inspection, repairs, overrides, product changes and unusual operating conditions to help improve labels and acceptance.
Establish Monitoring, Retraining, and Rollback Rules
Establish who is responsible for performance monitoring, who instigates performance investigation, when retraining is permissible, how to validate new versions, and how to restore a previous version. Model lifecycle management should not be something that is considered after the model has been launched into production.
Replicate Proven Use Cases Before Increasing Model Complexity
A model that reliably predicts one costly failure mode across ten similar assets may create more value than a complex platform that attempts to predict everything. Scale the use case and workflow, only add algorithmic complexity to address a known limitation.
Define Governance, Ownership, and Accountability
Assign ownership for data quality, model performance, alert handling, maintenance response, retraining, cybersecurity, change approval, and business reporting. Without these owners, a technically successful pilot can become an orphaned system.
How Should Manufacturers Choose the Right Predictive Analytics Solution?
Solution selection for predictive analytics in manufacturing should work backward from the operational problem, not forward from a vendor feature list. The core question is whether the solution can turn available data into a reliable prediction early enough to support a useful decision.
Start With the Use Case and Data Environment, Not the Tool
Document the target outcome, decision owner, prediction horizon, latency, data sources, assets, integrations, and success KPI before evaluating software. This prevents an advanced platform from forcing the plant to redesign its process around the tool.
Decide Between an Off-the-Shelf Platform and a Custom Solution
Standardized equipment and common use cases are well suited for off-the-shelf platforms that support a limited number of connectors and can be rapidly configured. Custom solutions accommodate proprietary processes, unique data modalities, complex legacy integration or workflows that create strategic differentiation. Neither option is automatically superior.
Evaluate Integration, Deployment, and Explainability Requirements
Check compatibility with MES, ERP, SCADA, historians, CMMS, edge infrastructure, cloud environments, identity systems, and security architecture. Figure out what consumers must understand about confidence, contributing signals, or probable causes for them to take action.
Evaluate Lifecycle Support, Not Just Initial Model Accuracy
Ask how monitoring, drift detection, retraining, model versioning, approval, rollback, auditability, security updates, and production support are handled. A vendor demo shows the first model; a production plan explains what happens after the plant changes.
Look for Relevant Industrial and AI Delivery Evidence
Evaluate evidence of ML engineering, MLOps, industrial data integration, security practices, and measurable outcomes. Prefer traceable case studies and production integration evidence over generic claims about “AI-powered transformation.”
What Will Shape Predictive Manufacturing Analytics Next?
The next phase of predictive analytics in manufacturing will be more real-time, multimodal, context-aware, and trustworthy. NIST’s July 2026 roadmap highlights digital twins, edge AI, multimodal industrial data, explainability, reliability, physics-informed learning, generative AI, and foundation models as important directions.
Real-Time Edge Prediction Will Expand
More inference will move close to production equipment where latency, bandwidth, connectivity, privacy, or continuity make cloud-only processing impractical. Central platforms will remain useful for training, governance, fleet analytics, and model management.
Digital Twins Will Combine Simulation With Live Production Data
Digital twins can combine a computational representation of an asset or process with live operational data. That opens opportunities to compare predicted future states with both historical patterns and modeled physical behavior, especially where real failure examples are scarce.
Predictive Systems Will Move Closer to Prescriptive Decisions
The progression is straightforward: what is happening → what will happen → what should we do? The final step is more challenging, as constraints, consequences, uncertainty and safety need to be taken into account. There will be a need for human intervention in high impact decisions.
Multimodal AI Will Combine Sensor, Vision, and Operational Data
Models can increasingly combine time-series telemetry, images, maintenance text, production records, quality results, and engineering information. This matters because developing failures and defects often leave evidence in more than one data modality.
Industrial AI Will Place More Emphasis on Trust, Explainability, and Reliability
Industrial AI should be evaluated on its ability to do a job, not for being novel. A less accurate, but still calibrated, model that can explain meaningful signals, degrades safely, and earns trust by the operator might be more valuable than a state of the art model that is totally unpredictable after a process change.
How BrainX Delivers Predictive Manufacturing Solutions
BrainX Technologies can support predictive initiatives from use-case discovery and data-readiness assessment through data engineering, custom modeling, integration, deployment, and monitoring. BrainX’s AI development services publicly include predictive analytics, time-series analysis, forecasting-related capabilities, PoC development, integration, deployment, and monitoring.
A manufacturing engagement should commence with the production problem and its economics: what is the event to be predicted; what data will indicate the event; how much lead time is useful; who will do something and how will value be measured. The delivery scope can then extend to sensor and historian pipelines, MES/ERP integration, time-series analytics, anomaly detection, predictive models, dashboards, workflow integration, and lifecycle monitoring.
Conclusion
The first question manufacturers should ask is not where can AI be implemented throughout the plant, but rather what can AI do in the plant?
It is a better strategy to be able to recognize one high cost, regular, predictable and actionable problem, and to demonstrate that available data can inform an early and reliable intervention.
When implemented properly, predictive analytics in manufacturing can be an operating cycle that links signals, context, forecasts, human decisions, maintenance or process actions and verified outcomes. Measure that loop against a baseline, learn from false alarms and missed events, and scale only after the first use case demonstrates durable operational value.
Frequently Asked Questions
What Is Predictive Analytics in Manufacturing?
Predictive analytics in manufacturing uses historical and real-time factory data to estimate future outcomes such as equipment failures, defects, bottlenecks, yield changes, or process deviations. It combines operational signals with context from systems such as MES, ERP, SCADA, historians, maintenance records, and quality systems so teams can act before the predicted event affects production.
How Is Predictive Analytics Different From Predictive Maintenance?
Predictive maintenance is one application of predictive analytics. It focuses on equipment condition, degradation, failure probability, or remaining useful life. Predictive analytics is broader and can also forecast defects, cycle times, bottlenecks, yield, process variation, energy use, and other manufacturing outcomes.
What Data Is Needed to Build Predictive Models for a Factory?
The required data depends on the outcome being predicted. Common sources include sensor telemetry, PLC/SCADA values, historians, MES events, ERP data, CMMS maintenance history, quality results, recipes, batches, work orders, and operator records. Data quality, timestamp alignment, operating context, and trustworthy labels are usually more important than raw volume.
Which Manufacturing Processes Benefit Most From Predictive Analytics?
The strongest candidates are economically important processes with observable precursors and enough lead time to intervene. Common examples include rotating-equipment maintenance, tool degradation, defect-risk prediction, yield-sensitive processes, bottleneck forecasting, cycle-time prediction, and abnormal energy consumption.
How Long Does a Predictive Analytics Implementation Take?
There is no reliable universal timeline. A sensor-ready PoC on one machine family is far simpler than a production deployment requiring new instrumentation, MES/CMMS integration, edge infrastructure, high availability, cybersecurity review, and multi-site validation. Data readiness and integration complexity usually shape the schedule more than model training alone.
How Can Manufacturers Calculate the ROI of Predictive Analytics?
Start with the operational baseline, then quantify avoided downtime, reduced scrap and rework, lower emergency repair cost, capacity gains, yield improvement, or energy savings. Subtract sensor, data, integration, infrastructure, development, support, and model-management costs. Use plant-specific economics rather than generic vendor ROI percentages.