Key Takeaways
- Predictive analytics in supply chain is best utilized when it yields outputs that can be used for decision making, rather than reporting. Start with one operational decision such as stockout risk, lead-time prediction, demand forecasting, or ETA accuracy.
- Treat data readiness as the real project. In the first 60 days, the main focus is more on the clean data of item, location, supplier, unit-of-measure and timestamped events than on advanced modeling.
- In order to get to machine learning, beat simple baselines first. If a model cannot outperform a seasonal naive forecast or a clear planning rule, it should not go live.
- Design to implement workflow from the start. Predictions add value when they are displayed in planner screens, alerts, approval flows, APIs or ERP/WMS/TMS workflows.
- A 4–8 weeks of piloting is expected, followed by hardening pipelines, governance, monitoring, integrations and multi-site rollout in 3–6 months.
- Clinical criticality, substitutions, expiration, recall, traceability and PHI boundaries require additional controls within a healthcare supply chain.

In 2026, supply-chain leaders are not struggling because teams lack effort. They are struggling because too many decisions still depend on stale signals, delayed reports, and manual exception handling. Lead times shift without warning. Tariffs and regional disruptions change sourcing plans. Promotions distort demand. Supplier performance drifts quietly. Logistics networks reroute overnight. That is why predictive analytics in supply chain has moved from a side initiative to an operating requirement.
The point is not to add more dashboards. The point is to help planners, buyers, logistics teams, and operations leaders act before risk becomes a stockout, OTIF miss, expedited freight cost, or service failure.
That urgency is not hypothetical. McKinsey projects that disruptions last a month or more on average every 3.7 years and also reports that many supply-chain-planning IT projects exceed both budget and time estimates and don't deliver the expected results.
So the problem remains, how to create predictions that a business can trust, and to put those predictions into the workflow where business decisions are already made.
What Is Predictive Analytics in Supply Chain?
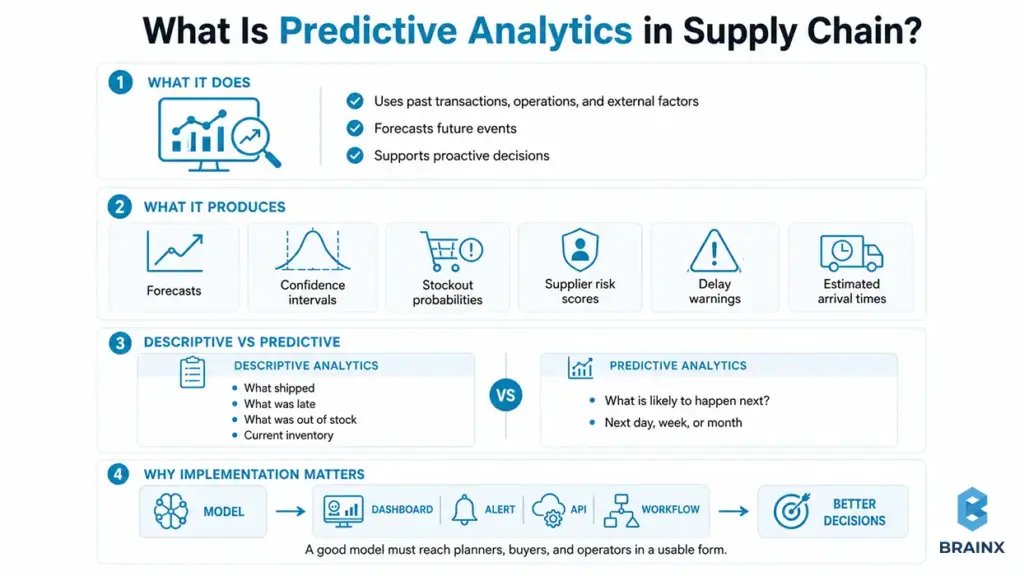
In terms of how this can be implemented, predictive analytics in supply chain involves leveraging data from past transactions, operations, and external factors to forecast future events and make proactive decisions.
It turns raw operational history into forward-looking outputs such as forecasts, confidence intervals, stockout probabilities, supplier risk scores, delay warnings, or estimated arrival times.
Descriptive analytics is something which most companies already have. They can view what was shipped, what was late, what was out of stock and what inventory they have. The next question in predictive analytics is, “What is likely to occur next week, month, or tomorrow if we don't take any action?”
The implementation lens matters. A model that performs well in a notebook is not enough. The prediction has to reach a planner, buyer, operator, dashboard, alert, API, or system workflow in a form that changes a decision.
A simple implementation lens looks like this:
| Analytics Layer | Core Question | Typical Supply Chain Example |
| Descriptive | What happened? | Last week’s fill rate by DC |
| Diagnostic | Why did it happen? | Late supplier receipts drove stockouts |
| Predictive | What is likely to happen next? | Stockout probability over the next 14 days |
| Prescriptive | What should we do about it? | Rebalance inventory or expedite a lane |
Predictive Analytics in Supply Chain vs Demand Forecasting vs Supply Planning
Demand forecasting is one use case inside the larger predictive layer. It estimates future demand. Supply planning processes this demand signal, adds constraints like lead time, capacity, MOQ, service targets, inventory policy, and many others and converts it to an execution plan.
The practical difference can be simply explained as follows:
- Demand forecasting is the prediction of the probable demand from a customer, channel or site.
- Predictive analytics also covers supplier risk, lead-time variability, stockout probability, ETA prediction, returns forecasting, and maintenance risk.
- Supply planning converts those predictions into replenishment, production, allocation, and exception-management decisions.
Take, for instance, a demand forecast that indicates a DC requires 1200 units next week. If supplier lead time is more than 9 days, then a predictive risk model states that there is a 35% chance of stockout. A planning workflow then decides whether to raise reorder points, rebalance inventory, expedite a lane, or accept the risk.
That distinction matters because many teams say they “do predictive analytics” when they really mean one monthly forecast run. In practice, the broader discipline is cross-functional and much closer to daily operational decisions.
Where Predictive Analytics Sits in Modern Supply Chain Management Systems (ERP/WMS/TMS)
In most companies, the predictive layer is not a replacement for ERP, WMS or TMS. It sits around them and makes those systems more forward-looking.
ERP remains the system of record for orders, purchasing, inventory valuation, financials, and master data. WMS owns warehouse events, receipts, picks, cycle counts, and inventory movements. TMS has control over shipment planning, carrier milestones, freight execution and delivery events.
Predictive models pull signals from those systems, score future risk, and then push outputs back into the places where teams already work.
The most typical output paths are:
- Devise prioritized exceptions, risk heatmaps, and recommended actions in planner workbenches and dashboards.
- Alerts and workflows via email, Slack, Teams, ticketing tools, or task queues.
- System-to-system APIs delivering reorder triggers, ETA updates, risk scores and/or allocation recommendations to ERP, WMS, TMS or planning tools/systems.
That is why architecture and process design matter as much as model quality. Predictions that live in a notebook usually die in a notebook.
Why Predictive Analytics in Supply Chain Matters More in 2026
Predictive analytics in supply chain matters more in 2026 because the operating environment is now structurally unstable rather than temporarily noisy. The World Economic Forum’s 2026 report says uncertainty defines the global risk outlook, with geoeconomic confrontation the top short-term risk. McKinsey’s 2025 survey found 82% of companies were affected by new tariffs, with 20% to 40% of supply-chain activity impacted in some way. At the same time, only 42% of respondents had visibility into tier-two suppliers or beyond, and only 19% said they were deploying AI tools at scale.
In plain English, supply chains now have more moving parts, less slack, and a higher cost of being late. Waiting to react after the miss is usually more expensive than anticipating the miss. McKinsey’s long-run estimate that month-long disruptions occur every 3.7 years on average only reinforces that shift from reactive planning to probabilistic planning.
A useful way to frame the impact areas is below:
| Impact Area | What Changes When Predictions Improve | KPI Examples |
| Cost | Less excess inventory, fewer expedites, lower waste | Carrying cost, expedite freight, warehousing cost |
| Service | Better product availability and more consistent delivery | OTIF, fill rate, stockout rate |
| Cash | Less capital trapped in slow-moving stock | Inventory turns, DIO, working capital |
| Risk | Earlier warning on delays, failures, and shortages | Disruption lead time, supplier risk score, exception response time |
Business Outcomes It Influences (Cost, Service Levels, Cash, Risk)
When leadership asks whether this is worth funding, the answer should not be “because AI.” It should be “because it moves business mechanics.”
McKinsey reports that AI-driven forecasting can reduce errors by 20% to 50%, cut lost sales and product unavailability by up to 65%, reduce warehousing costs by 5% to 10%, and lower administration costs by 25% to 40%. In distribution operations, McKinsey also reports inventory reductions of 20% to 30%, logistics-cost reductions of 5% to 20%, procurement-spend reductions of 5% to 15%, and example fill-rate gains of 5% to 8%. Those are exactly the outcome categories executives care about: margin, service, and cash.
Inventory economics makes the case even clearer. APQC defines inventory carrying cost broadly to include cost of capital, storage, insurance, taxes, handling, shrinkage, and obsolescence; its benchmark dataset shows a median carrying-cost measure of 10% of inventory value. Finance teams often model an even fuller economic burden in the 20% to 30% range, especially in faster-moving categories where obsolescence is material.
What Changed Since 2023–2025 (Data Stacks, MLOps, LLM Ops Copilots—Where They Help, Where They Don’t)
The biggest change since 2023–2025 is not that models suddenly became magical. It is that the stack around them became more production-ready.
Lakehouse architectures are now more common, making it easier to unify operational and analytical data. Feature stores and semantic layers help teams reuse tested variables and keep KPI definitions consistent. MLOps practices are also more standardized, with model registries, CI/CD, drift monitoring, audit logs, and retraining workflows becoming part of serious deployments.
LLM copilots have also changed how teams work. They can help with documentation, data mapping, SQL drafting, exception summaries, supplier communication, and planner-facing explanations. They are useful accelerators when humans review the output.
But they do not replace strong data engineering, deterministic business rules, probabilistic forecasting, or optimization logic. Supply chain decisions require traceability, constraints, and controllable behavior.
The practical rule is this: use copilots to speed up analysis and communication, not to guess replenishment logic, supplier rules, safety stock policy, or compliance boundaries.
Core Use Cases (With the Data You Typically Need)
The fastest way to make predictive analytics in supply chain useful is to anchor it to decisions the business already makes every day.
Each use case should be mapped to four things: the dataset you can reliably assemble, the model output you need, the workflow it will enter, and the KPI it is expected to improve.
This is where predictive analytics in supply chain management becomes real. The model is only half the system. The other half is the workflow, governance, and adoption layer around it.
| Use Case | Typical Inputs | Likely Model Type | Operational Output | Primary KPI |
| Demand Forecasting | Orders, POS, promotions, price, holidays, weather, stockouts | Hierarchical time series, boosting, probabilistic forecasting | SKU-location forecast and confidence interval | WAPE, bias, service level |
| Inventory Optimization | On-hand, lead times, MOQ, service targets, replenishment rules | Probabilistic forecast + inventory policy logic | Reorder point, order qty, stockout risk | Turns, stockouts, working capital |
| Supplier Risk / Lead-Time Prediction | POs, ASNs, OTIF, quality events, geography, financial signals | Classification, regression, survival models | Supplier risk score, expected lead time | OTIF, late POs |
| Predictive ETA / Delay Risk | Carrier events, GPS, route history, weather, customs data | ETA regression, sequence models | ETA with confidence band | On-time delivery |
| Asset Maintenance | IoT sensors, maintenance logs, runtime, error codes | Anomaly detection, remaining-useful-life models | Failure risk, maintenance window | Downtime, repair cost |
| Returns Forecasting | Return codes, channel, customer cohort, item attributes | Classification + forecasting | Expected returns by SKU/channel | Return rate, reverse-logistics cost |
Demand Forecasting in Predictive Analytics in Supply Chain Management
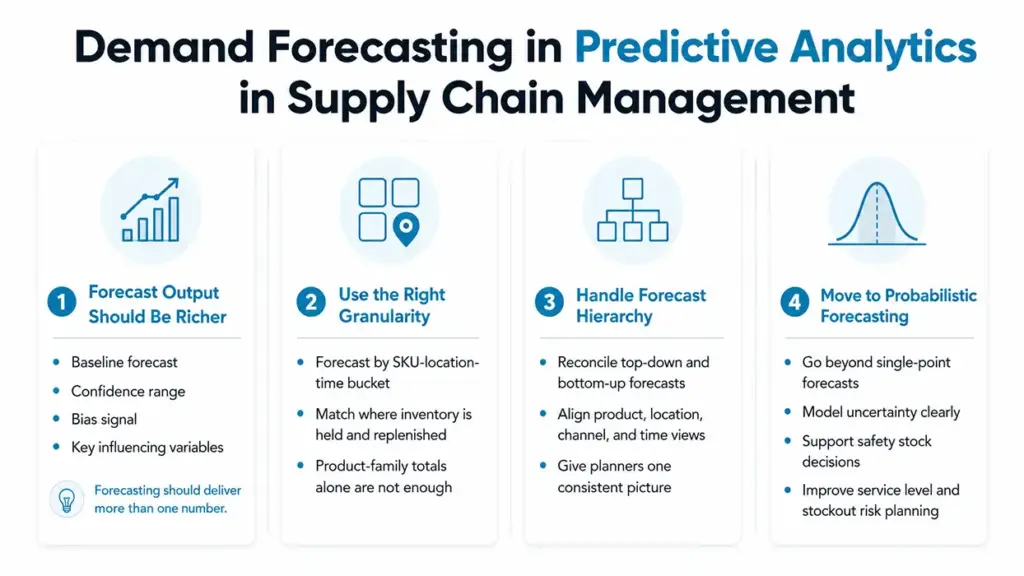
In predictive analytics in supply chain management, demand forecasting should produce more than one number. It should give planners a baseline forecast, a confidence range, a bias signal, and a clear view of what variables are influencing the result.
The most useful granularity is usually the SKU-location-time bucket, not just product-family monthly totals. If you cannot forecast at the level where inventory is actually held, replenished, or allocated, the downstream value will be limited.
Strong implementations also handle hierarchy. A top-down category forecast and a bottom-up SKU forecast should not fight each other without reconciliation. Planners need a consistent view across product, location, channel, and time.
For many teams, the biggest maturity jump is moving from single-point forecasts to probabilistic forecasts. That shift matters because safety stock, service levels, and stockout risk are all uncertainty problems, not average-demand problems.
Inventory Optimization & Reorder Predictions (Safety Stock, Stockout Risk)
This is where forecasts convert into money. Inventory optimization combines demand uncertainty, lead-time variability, service targets, pack sizes, and order rules to recommend reorder points, safety stock, and order quantities.
The output should include probabilities, not just thresholds. A planner should be able to see that a SKU has, for example, a high stockout probability despite acceptable average inventory, because lead-time variance widened last month.
Supplier Risk & Lead-Time Prediction (OTIF, Disruptions, Quality)
Supplier models should estimate both expected lead time and expected variability. Average lead time alone is not enough.
The best implementations merge purchasing history with ASN quality, defect rates, dispute history, geography, weather exposure, trade risk, and vendor concentration. A supplier that is “usually on time” but highly volatile is a different planning problem from one that is consistently slow but predictable.
Predictive ETAs and Logistics Delay Risk (TMS + Carrier Signals)
Predictive ETA models estimate when a shipment will really arrive, not when the plan says it should arrive. That sounds simple, but it can materially reduce dock congestion, expedite costs, and customer-service escalation.
The input mix usually includes carrier milestone events, route history, dwell time, customs events, traffic, weather, and facility cut-off behavior. The operational output is best surfaced as confidence bands and risk flags rather than a false sense of precision.
Predictive Maintenance for Supply Chain Assets (Warehouse Automation, Fleet)
For warehouse automation, conveyors, AS/RS systems, sorters, forklifts, or fleet assets, predictive maintenance reduces unplanned downtime and protects throughput.
This use case works best when maintenance logs and telemetry are both available. If you only have sensor data without work-order history, or work-order history without runtime data, the first step is instrumentation discipline, not model complexity.
Returns and Reverse Logistics Forecasting
Returns forecasting is increasingly valuable in industries with high e-commerce mix, serialized products, service parts, or regulated disposal processes.
The important design choice is whether you are forecasting volume, reason codes, recoverable value, or processing capacity. Those are different needs, and they often require different features and different owners.
If BrainX has related content, this section naturally supports links to forecasting, optimization, or supply chain AI use cases.
Reference Architecture for Implementing Predictive Analytics (2026 Stack)
To scale predictive analytics in supply chain, you need an architecture that is reliable, observable, secure, and easy to integrate with operational systems.
The 2026 stack does not need to be exotic. It needs to be disciplined. A practical blueprint usually follows this flow: source-system ingestion, governed storage, transformation and feature engineering, model training, model serving, workflow integration, and continuous monitoring.
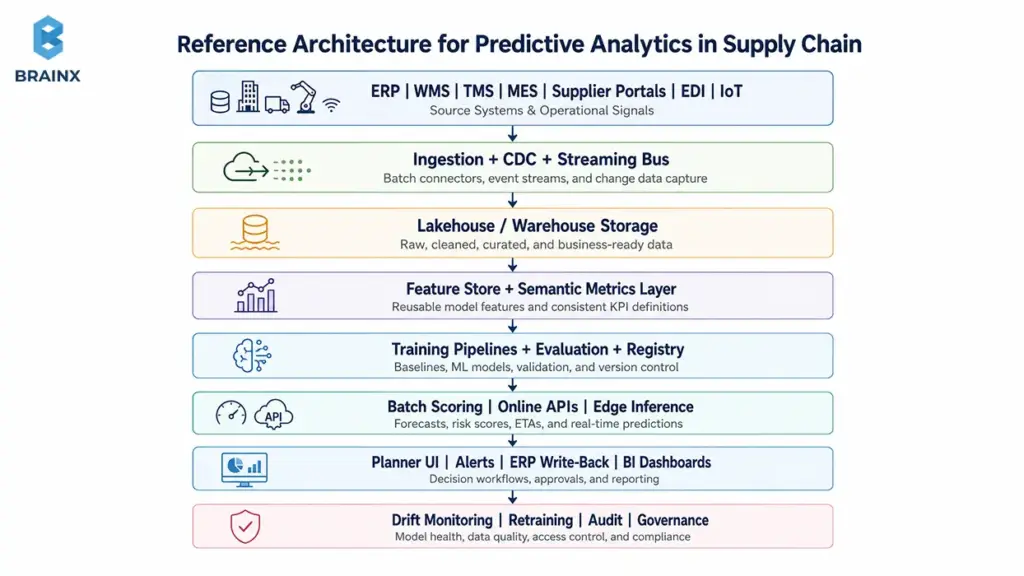
The core layers are:
- Ingestion from ERP, WMS, TMS, MES, supplier portals, EDI, IoT, and external data.
- Lakehouse or warehouse storage with curated raw, cleaned, and business-ready zones.
- Transformation pipelines with data quality checks, lineage, and data contracts.
- Feature store and semantic layer for reusable variables and consistent metrics.
- Training environment with tracked experiments, reproducible runs, and model evaluation.
- Serving layer through batch scoring, online APIs, or edge inference.
- Monitoring for data freshness, drift, latency, forecast error, and business KPI movement.
- Governance through RBAC, audit logs, retention controls, and regulated-data boundaries.
Data Sources: ERP, WMS, TMS, MES, Supplier Portals, IoT, EDI
Most programs fail when they over-focus on one system. Demand signals often live across ERP order data, WMS stock movements, TMS shipment milestones, supplier portal acknowledgments, MES production status, EDI events, and external signals such as weather or tariff updates.
The real design question is not “what system do we have?” It is “what event history exists at the grain needed for prediction?”
Batch vs Streaming: When You Need Real-Time Predictions
Not every use case needs streaming. Weekly demand forecasting, monthly safety stock refreshes, and supplier-scorecard updates usually work well in batch.
Streaming becomes valuable when conditions change within hours or minutes and the business can still act in time. Typical examples are predictive ETAs, warehouse equipment alerts, or exception rerouting. If the business process is still reviewed once a day, real-time infrastructure may add cost without adding value.
Feature Store and Semantic Layer (Metrics Consistency Across Teams)
A feature store solves one recurring supply-chain problem: the same variable gets defined five ways by five teams. A semantic layer solves the sibling problem: forecast accuracy, service level, or inventory turns get reported differently in finance, operations, and analytics.
If you skip those two layers, you usually end up with “model accuracy” arguments that are actually definition arguments.
Model Training + Serving Patterns (Batch Scoring, Online APIs, Edge)
Three serving patterns cover most use cases:
- Batch scoring for forecasts, replenishment scores, and network planning.
- Online APIs for ETA prediction, exception routing, or planner UI interactions.
- Edge inference for equipment use cases where latency or connectivity matters.
Choose the simplest pattern that matches the decision speed. Overengineering serving is one of the fastest ways to slow adoption.
MLOps: CI/CD, Model Registry, Drift Monitoring, Retraining Triggers
Production systems need versioned data pipelines, model lineage, automated testing, approval gates, deployment controls, and standard rollback procedures.
Your retraining trigger should also be explicit. Common triggers include forecast bias threshold breaches, drift in lead-time distribution, promotion calendar changes, supplier-network shifts, or visible deterioration in OTIF and fill-rate metrics.
Security & Governance (RBAC, PII/PHI Boundaries, Auditability)
Access control should be role-based, not team-based. A planner, buyer, finance analyst, and data scientist often need different slices of the same workflow.
Where regulated data enters the process, boundaries matter. HHS says the HIPAA Security Rule sets administrative, physical, and technical safeguards for ePHI. FDA guidance on Part 11 addresses electronic records and signatures in regulated contexts. And NIST’s AI RMF positions AI governance as a full-lifecycle trustworthiness issue rather than a last-mile compliance task.
This section aligns naturally with BrainX content on data engineering, cloud modernization, or enterprise AI architecture.
Data Readiness Checklist (Before You Build Anything)
Before buying tools or commissioning model work, use this test: is the business ready to operationalize predictive analytics in supply chain, or are you about to fund a very expensive data-cleaning project under an AI label?
A practical readiness checklist looks like this:
| Readiness Area | Minimum Viable Standard | Common Failure Mode |
| Item Master | Consistent SKU IDs, categories, units, lifecycle status | Duplicate SKUs, bad pack conversions |
| Location Master | Stable warehouse/store/site IDs and hierarchy | Missing node mapping |
| Supplier Master | Supplier IDs, terms, lane mappings, lead-time history | One vendor under multiple names |
| Transaction Events | Timestamped receipts, issues, transfers, adjustments | Manual backfills, missing event times |
| Historical Depth | Enough history to cover seasonality and policy shifts | Six months of data for annual cycles |
| External Events | Promotions, holidays, weather, pricing, constraints | Models blind to demand shocks |
| Workflow Ownership | Clear decision owner for each output | Good model, no action path |
Master Data: Item, Location, Supplier, BOM, UoM Normalization
Master data defects rarely look dramatic, but they destroy trust. If one SKU appears in multiple units of measure, if locations are re-coded without lineage, or if suppliers have duplicate identities, the model may look accurate in aggregate and still fail operationally.
Normalize this before you model anything ambitious.
Historical Depth and Seasonality Coverage (Minimum Viable History)
As a rule of thumb, 18 to 24 months of history is a strong starting point for seasonal demand work, though some categories can work with less and others need more. Promotions, product launches, recalls, pricing resets, and policy changes should be tagged, not left for the model to infer from noise.
The wrong question is “how much data do we have?” The right question is “how many relevant cycles do we cover?”
Event Quality: Stock Movements, Receipts, Adjustments, Backorders
Supply-chain models depend on clean event timing. Stockouts, receipts, cancellations, substitutions, and backorders need timestamps and reason codes that mean something.
If your events are entered in bulk at end of day, or adjusted after the fact without auditability, a model may learn your data-entry habits instead of your actual operation.
Common Blockers: Siloed Systems, Manual Spreadsheets, Missing Timestamps
The recurring blockers are familiar: disconnected source systems, spreadsheet overrides that never feed back into the core record, gaps in timestamped milestones, and unclear ownership for master-data fixes.
That is why the best early milestone is often not “first model trained.” It is “first trustworthy data product shipped.”
This section pairs well with a BrainX data audit or discovery workshop offering.
Step-by-Step Implementation Plan (From Pilot to Scale)
Most predictive analytics in supply chain initiatives do not fail because the math is too hard. They fail because the scope is too wide, the data foundation is weak, or the model never reaches the daily workflow.
A successful rollout is an operational change program with an ML component, not the other way around. The phases below are designed to move from a small, measurable pilot to a scalable production capability.
| Phase | Typical Duration | Primary Owner | Key Artifacts | Acceptance Criteria |
| Pick First Use Case | 1–2 weeks | Product owner + SME | Problem statement, baseline KPI, ROI hypothesis | Clear business owner and measurable target |
| Build Data Pipeline | 2–4 weeks | Data engineer | Source map, data model, quality checks, MVP pipeline | Reproducible refresh with trusted metrics |
| Model Development | 1–3 weeks | ML engineer / DS | Baselines, model card, holdout results | Beats baseline and explains failure cases |
| Deploy Into Workflows | 1–3 weeks | Product + engineering | UI/API/alert integration, access controls | Planners can act without leaving workflow |
| Measure and Scale | Ongoing | Product + ops leadership | KPI dashboard, drift alerts, rollout plan | Sustained value and onboarding plan for next sites |
Phase 1 — Pick the First Predictive Analytics in Supply Chain Use Case
Start with the highest-value, lowest-friction decision. The best first use cases usually sit in demand forecasting for a constrained category, stockout-risk prediction for high-value SKUs, supplier lead-time prediction for unstable vendors, or ETA prediction for critical flows.
Selection criteria matter more than model sophistication. Pick a use case with a/an:
- clear decision owner, such as a planner, buyer, logistics manager, or operations lead.
- measurable KPI and current baseline.
- accessible data from at least one business unit, site, or product group.
- decision window where earlier action can still create value.
- workflow where the prediction can be tested without disrupting operations.
Acceptance criteria:
- A signed-off use-case charter with scope, grain, horizon, KPI, and owner.
- Baseline performance for the current process.
- A clear workflow showing where predictions will appear and who will act.
Artifacts:
- One-page PRD for the prediction product.
- Data source inventory and access approvals.
- KPI definition sheet and measurement plan.
Phase 2 — Build the Data Pipeline (MVP → Production)
Start with a narrow MVP data product, but structure it like something that can become production-grade.
That means source lineage, refresh logic, data quality checks, backfill rules, and metric definitions should be explicit from day one. The first version can be small, but it should not be disposable.
The pipeline should include:
- Ingestion and staging tables with lineage.
- Transformations with null checks, range checks, and referential-integrity tests.
- Curated business-ready tables aligned to model inputs and KPI reporting.
- Documented data contracts and data owners.
- Reconciliation checks against source-system totals.
Acceptance criteria:
- The dataset can be rebuilt with repeatable results.
- Freshness expectations are defined and tested.
- Key joins, IDs, units of measure, and timestamps are validated.
Artifacts:
- Data model diagram.
- Data dictionary.
- Quality dashboard.
- Lightweight pipeline runbook.
Phase 3 — Model Development (Baselines First, Then ML)
Build simple baselines before introducing machine learning. Many teams skip this step and end up with an impressive model that does not beat a disciplined planning heuristic.
Start with a seasonal naive forecast, moving average, or simple regression. Then test classical time-series methods or tree-based ML only if they add measurable lift.
The goal is not to prove that AI works. The goal is to prove that the new system makes better decisions than the current process.
A practical sequence is a/an:
- baseline model.
- improved statistical model.
- ML model where complexity is justified.
- probabilistic output where uncertainty affects the business decision.
- error analysis by segment, not just one global accuracy number.
Acceptance criteria:
- The model beats the baseline on holdout data and the business KPI.
- Error analysis is reviewed by product, operations, and domain SMEs.
- Failure modes are documented before deployment.
Artifacts:
- Experiment tracking records.
- Model card.
- Feature list.
- Evaluation report mapped to business impact.
- Backtesting framework for repeatable comparisons.
Phase 4 — Deploy Into Workflows (Planner UI, Alerts, API to ERP)
Deployment is where value either appears or disappears. A prediction that does not reach the workflow is just a chart.
The safest pattern is to start with controlled visibility, then move toward automation as trust improves. For example, you may begin with a planner dashboard, then add alerts, then integrate approved recommendations into ERP, WMS, or TMS workflows.
Common deployment options include:
- Planner UI with ranked exceptions and drill-down context.
- Alerting rules with thresholds.
- Read-only dashboards for shadow-mode testing.
- API endpoints for other systems to consume predictions.
- Controlled write-back to ERP or planning tools after governance is clear.
Acceptance criteria:
- Planners can see, understand, and act on the output without leaving their workflow.
- Latency and availability targets are met.
- RBAC and audit logging are in place.
- Adoption is measured through views, actions, overrides, and reason codes.
Artifacts:
- Integration specs.
- User training material.
- Exception-management playbook.
- Override tracking logic.
- Approval and escalation workflow.
Phase 5 — Measure, Iterate, and Scale (Multi-Site, Multi-Echelon)
Once the first use case works, do not immediately flood the roadmap with ten more. Scale by pattern, not by enthusiasm.
The goal is to reuse the data contracts, feature logic, model governance, monitoring approach, and deployment template that made the first use case successful.
Scaling usually means:
- Adding new sites, regions, or categories with templated pipelines.
- Expanding from single-echelon to multi-echelon planning.
- Improving segmentation for slow movers, high runners, or volatile categories.
- Adding monitoring and incident-response ownership.
- Creating quarterly value reports tied to finance and operations metrics.
Acceptance criteria:
- KPI improvement is sustained across multiple planning cycles.
- Monitoring catches drift before stakeholders do.
- Business owners request expansion because the first use case proved value.
Artifacts:
- Multi-site rollout plan.
- Governance cadence.
- Retraining runbook.
- KPI dashboard.
- Next-use-case roadmap.
Model & Method Selection (Practical, Not Academic)
The goal is not to deploy the most advanced model on paper. The goal is to choose the simplest method that can beat the baseline, survive drift, and remain understandable enough for operational teams to trust.
In practice, predictive analytics in supply chain management usually needs a portfolio of methods. Long-tail SKUs may work better with simple baselines. High-volume categories may justify ML. Inventory and service-level decisions usually need probabilistic forecasting. Replenishment and allocation often require an optimization layer on top of predictions.
| Approach | Best For | Strengths | Watch-Outs |
| Seasonal Naive / Moving Average | Baseline forecasting | Fast, transparent, cheap | Often too weak for volatile categories |
| Classical Time Series | Stable seasonality and trend | Strong with cleaner demand patterns | Struggles with rich external features |
| Tree-Based ML / XGBoost | Multi-factor demand and risk | Handles many features, nonlinear patterns | Needs careful leakage control |
| Probabilistic Forecasting | Inventory and service-level decisions | Gives uncertainty, not just point estimates | Harder for teams new to distributions |
| Causal / Uplift Approaches | Promotions, pricing, interventions | Better for “what if” questions | Needs stronger experimental design |
| Optimization Layer | Replenishment, allocation, routing | Converts predictions into action | Depends on good constraints and policies |
Baseline Models You Should Beat (Naive Seasonal, Moving Average)
Every serious project should begin with at least two baselines: a seasonal naive forecast and a moving average or lag-based rule.
Why? Because a surprising number of “AI” projects do not beat disciplined heuristics once you test them honestly on holdout periods.
When Classical Time Series Is Enough vs When ML Wins
Classical time-series methods are often enough when demand is stable, history is long, and external drivers are limited.
ML tends to win when demand depends on many interacting variables such as promotions, availability, weather, customer mix, route behavior, or supplier attributes. Even then, hybrid approaches are common: time series for base signal, ML for adjustments and risk.
Probabilistic Forecasting for Safety Stock and Service Levels
Point forecasts are weak inputs for inventory policy because replenishment is driven by uncertainty, not averages.
Probabilistic forecasting gives prediction intervals or full distributions. That is what lets you estimate stockout probability, not just expected demand, and it is why this method is usually the right fit when service levels and safety stock are the business goal.
Optimization Layer (How Predictions Turn Into Decisions)
Predictions alone do not move stock. Optimization and business rules do.
This is where lead times, service targets, MOQs, transport constraints, shelf life, warehouse capacity, substitution logic, and budget constraints convert predicted states into recommended actions. If you skip this layer, you often ship “insight” but not decisions.
KPIs, ROI, and Business Case (How to Prove Value)
If predictive analytics in supply chain does not move a business KPI, it is still a science project. The strongest business cases connect one model output to one operational action and one financial mechanism.
McKinsey’s research gives useful benchmark ranges for value framing: AI-driven forecasting can reduce forecast errors by 20% to 50% and cut lost sales and product unavailability by up to 65%, while AI-enabled planning and inventory work can reduce inventory by 20% to 30% and improve fill rates by 5% to 8% in some settings. On the cost side, APQC’s carrying-cost benchmark shows a median measure of 10% of inventory value, while finance-oriented full-cost scenarios often model 20% to 30%. Those ranges are why even modest inventory or service improvements can justify a pilot.
KPI Map by Use Case (Forecast Error, OTIF, Stockouts, Expedited Freight)
A clean KPI map looks like this:
| Use Case | Operational KPI | Financial Link |
| Demand Forecasting | WAPE, bias, forecast value add | Lower stockouts, lower overstock |
| Inventory Optimization | Stockout risk, safety stock, turns | Lower carrying cost, less trapped cash |
| Supplier Risk | OTIF, lead-time variance | Fewer expedites, fewer production delays |
| ETA Prediction | On-time delivery, exception lead time | Lower detention, better service |
| Maintenance | Downtime, MTBF, repair lead time | Higher throughput, lower disruption cost |
| Returns | Return rate, disposition cycle time | Lower reverse-logistics cost, better recovery |
Baseline and Experimentation (A/B or Phased Rollout Design)
The cleanest way to prove value is a phased rollout with matched cohorts, lanes, sites, or categories. True A/B designs are possible in some environments, but phased rollouts are usually more practical operationally.
The critical rule is this: compare against the process you would have used otherwise, not against a hypothetical target no one ever worked to before.
ROI Model Inputs (Carrying Cost, Obsolescence, Labor, Freight, Penalties)
A simple ROI structure is:
Annual value = inventory reduction + stockout avoidance + freight savings + labor savings + waste reduction − program cost
The specific inputs usually include carrying cost, obsolescence, shrinkage, expedite freight, manual planner effort, chargebacks or service penalties, and cash released from lower inventory days.
Cost, Timeline, and Team Roles (What It Really Takes)
The real cost of predictive analytics in supply chain is rarely just the model. It is data cleanup, workflow integration, monitoring, and the organizational work needed to make the prediction actionable. McKinsey’s planning-technology research is a useful warning sign here: 60% of supply-chain-planning IT implementations take longer or cost more than expected, or do not achieve anticipated outcomes.
Typical Timelines: 4–8 Weeks Pilot vs 3–6 Months Production Scale
A focused pilot can be accomplished within 4-8 weeks, if the source systems are available and the use case is limited.
Production scale typically gets established in 3-6 months due to its need to develop hardened pipelines, access controls, model monitoring, workflow design, documentation and change management. Rollouts across the network may take longer, particularly if data contracts and ERP integration are weak.
Roles: Product Owner, Data Engineer, ML Engineer, Domain SME, DevOps/MLOps
A lean but credible team usually includes:
| Role | What They Own |
| Product Owner | Scope, KPI, stakeholder alignment |
| Domain SME | Planning logic, exception handling, edge cases |
| Data Engineer | Ingestion, modeling, quality, orchestration |
| ML Engineer / Data Scientist | Baselines, training, evaluation, deployment logic |
| DevOps / MLOps | Environments, CI/CD, monitoring, rollback |
| Analytics / BI | KPI visibility and adoption reporting |
The highest-performing teams keep the SME involved weekly, not just at project kickoff.
Hidden Costs: Data Cleanup, Integrations, Change Management, Monitoring
Typical hidden costs are: reconciling master data, integrating old systems, redesigning exception flow, retraining planners and supporting models upon going live.
Budget for those on purpose. If not, they appear later as delays, distrust, or “the model is wrong” feedback that is really process friction.
Common Challenges (and How to Avoid Them)
Most issues appear after the first demo, not before it. That is why predictive analytics in supply chain should be designed as an operating capability, not a one-time model build.
The good news is that the most common failure modes are predictable. Problems with data quality, drift, plan adoption, and integration issues can be addressed early if they are part of the implementation plan.
Garbage-In/Garbage-Out (and How to Enforce Data Contracts)
The model will learn distorted reality if the data has no timestamps, if data in inventory is not in sync, or if the source systems change the meaning of the fields without warning.
The fix is not “better data science.” It is data contracts, quality rules, owner accountability, and alerts when critical inputs move outside acceptable ranges.
A practical data contract should define:
- Required fields by event type
- Accepted value ranges
- Timestamp rules
- Schema ownership
- Reconciliation logic
- Escalation paths when quality checks fail
You need to treat data quality like uptime. It should be continually measured, owned, monitored and improved.
Concept Drift: Promotions, Pricing Changes, New Suppliers
Drift is normal in supply chains. Promotions, assortment resets, supplier substitutions, new lanes, and macro shocks all change underlying patterns.
Plan for drift operationally. Track it, explain it, and retrain on explicit triggers. Keep in mind that with new SKUs and suppliers come cold-start cases that require fall-back rules and not optimism.
Human-In-The-Loop Adoption (Planner Trust, Override Tracking)
Planner trust is earned when the system explains itself, shows uncertainty, and improves from feedback.
Teams should be able to see why a risk score is high, what data influenced the recommendation, how confident the model is, and what action is expected. Without that context, even a strong model can look like a black box.
Overrides should also be treated as data, not resistance. When a recommendation is consistently being ignored by experienced planners, it might be a missing constraint, a weak feature, a workflow problem or may be something that the model doesn't yet know about as a business rule.
Identify who made the changes, why they made them and what took place after it. That feedback loop will improve the operating process and the model.
Integration Failures (ERP Write-Back, Latency, Reconciliation)
A recommendation that cannot be reconciled back to ERP, planning tools, or operational records becomes a side system. Side systems rarely scale.
Solve write-back governance early: who approves changes, what gets written automatically, how conflicts are handled, and what latency is acceptable.
Predictive Analytics in Healthcare Supply Chain (Special Considerations)
Predictive analytics in healthcare supply chain is unique because a poor prediction could become a clinical risk, not just an operational inefficiency.
For a retail or manufacturing business, a stock out could result in lost sales, late orders, or dissatisfaction with products. In health care, it can impact preparation for procedures, availability of medications, patient safety, decision making regarding substitutions, and recall responses.
That changes the implementation approach. The model design may look familiar, but the controls, auditability, prioritization logic, and governance boundaries need to be stronger from day one.
A drug shortage, according to FDA, is a time when there is an imbalance between the demand for, or expected demand for, a drug and its supply. While DSCSA is intended to facilitate traceability of certain prescription drugs at the package level. Additionally, HHS emphasizes that ePHI should be protected by administrative, physical, and technical safeguards. Those requirements shape how healthcare supply chain systems should handle data access, traceability, and operational accountability.
High-Stakes Items: Stockouts, Substitutions, Expirations, Recalls
The healthcare supply chain should have a better prioritization logic as all items do not carry the same risk.
Having a stock out on a routine consumable and a stock out on a critical therapy, sterile injectable, implant, emergency medication, or item should not be in the same exception queue.
The model should understand:
- clinical criticality,
- substitution rules,
- expiration windows,
- lot and serial traceability,
- supplier reliability,
- procedure demand,
- and recall workflows.
A valuable output is not only “what to buy.” It is “what is at risk, why it is at risk, and what action is safe to take.”
Data Sources: EHR Adjacency, Item Masters, PAR Levels, Utilization, Procedure Schedules
The most useful healthcare inputs usually include item masters, supplier records, purchase history, PAR levels, utilization by department, backorders, open requisitions, lot or serial records, and future demand proxies such as scheduled procedures.
You do not always need PHI to improve supply chain planning. In many cases, aggregated or de-identified utilization signals are enough.
The design principle should be simple: use the minimum necessary clinical-adjacent data to improve planning while keeping PHI boundaries explicit.
Governance: PHI Boundaries, Audit Trails, Vendor Risk Management
For predictive analytics in healthcare supply chain, governance must be visible in the architecture and the workflow.
It means, you get:
- clear PHI and PII boundaries,
- encryption at rest and in transit,
- RBAC and least-privilege access,
- audit logs for data access and model changes,
- vendor risk reviews for third-party tools,
- approval workflows for replenishment-policy changes,
- and incident-response plans tied to operational continuity.
Even if a model doesn't directly touch the PHI, the surrounding systems could. That is why it is important to engage compliance, security, supply chain, and clinical stakeholders in the early stages.
Quick-Win Use Cases for Predictive Analytics in Healthcare Supply Chain
The best quick wins are usually narrow, measurable, and high-stakes. Strong starting points include:
- Stockout-risk prediction for critical supplies by unit or location.
- Expiration-risk prediction for short-dated or temperature-sensitive inventory.
- Redistribution recommendations before waste occurs.
- Supplier lead-time risk scoring for essential vendors.
- Demand forecasting for OR kits or high-variability departments.
- Anomaly detection for sudden utilization spikes.
Start with a unit, category, or service line where measurement is feasible and stakeholders are motivated. That makes the first pilot easier to validate and easier to scale.
Getting Started: A 30/60/90-Day Plan
If you are starting predictive analytics in supply chain now, the goal of the first 90 days is not to “transform the network.” It is to create one trustworthy data product, one measurable use case, and one workflow that proves the model can influence decisions.
| Time Window | What To Deliver | Exit Criteria |
| First 30 Days | Data audit, KPI baseline, use-case selection, source mapping | One signed-off use case and baseline metric |
| Next 60 Days | MVP pipeline, baseline model, business-facing prototype | Working forecast/risk output visible to users |
| Next 90 Days | Hardened deployment, monitoring, runbook, scale plan | Controlled production rollout and next-use-case roadmap |
First 30 Days: Data Audit + Use-Case Selection + Baselines
Map the source systems, define the KPI, and build the baseline process first.
Do not discuss model architecture for three weeks if item IDs, timestamps, or inventory states are still disputed.
Next 60 Days: MVP Pipeline + Model + Workflow Prototype
Deliver a thin vertical slice: source data, transformation, baseline model, business prototype, and feedback loop.
If planners cannot see and comment on the output by this point, the team is still too far from the real workflow.
Next 90 Days: Production Hardening + Monitoring + Scale Plan
Add CI/CD, access control, drift monitoring, runbooks, and clear issue ownership.
The final deliverable is not just the first production use case. It is the reusable template for the second one.
How BrainX Helps With Predictive Analytics in Supply Chain
BrainX helps teams turn predictive analytics in supply chain from a promising concept into a production capability. We focus on the pieces that usually decide success or failure: data readiness, scoped pilots, workflow integration, MLOps, and measurable business outcomes.
What We Build (Data Pipelines, Forecasting, MLOps, Dashboards, Integrations)
Our typical delivery scope includes lakehouse and pipeline design, forecasting and risk models, feature engineering, model deployment, monitoring, planner dashboards, and integration into ERP, WMS, TMS, supplier portals, or healthcare workflows.
Where needed, we also help define semantic metrics, governance controls, approval workflows, and exception-management UX so the output can actually be used.
Typical Engagement: Discovery → Pilot → Production Rollout
A practical engagement usually starts with a discovery workshop and data-readiness audit, then moves into a single pilot use case with baseline KPIs and ROI assumptions.
From there, we harden the winning flow into production and create the architecture, runbooks, templates, and governance required to scale the next use cases faster.
What Success Looks Like (KPIs We Commit to Track)
Success is not “model deployed.” Success is a KPI movement you can defend.
That usually means forecast error, service level, OTIF, inventory turns, stockout risk, expedite freight, planner touches, or time-to-exception-response. If you are evaluating partners, ask who will own those definitions, how they will be measured, and how model drift will be handled after launch.
Conclusion
The companies getting the most value from predictive analytics in supply chain in 2026 are not the ones chasing the most advanced model on paper.
They are the ones connecting good data, realistic methods, solid governance, and workflow adoption to one measurable business decision at a time.
Start narrow. Fix the data foundations. Beat the baseline. Put the output where planners work. Track the KPI. Then scale the pattern.
If you want BrainX to help you scope the first use case, validate data readiness, or build the pilot-to-production roadmap, the clearest next step is to Book a Call.
FAQs on Implementing Predictive Analytics in Supply Chain
What Is Predictive Analytics in Supply Chain and How Is It Different From Demand Forecasting?
Predictive analytics in supply chain is the broader discipline of using historical and real-time signals to estimate future outcomes such as demand, stockout risk, late delivery, supplier delays, returns, or equipment failure. Demand forecasting is one use case inside that broader discipline. Forecasting predicts future demand; predictive analytics also covers lead times, ETAs, supplier risk, maintenance, and reverse logistics.
How Long Does It Take To Implement Predictive Analytics in Supply Chain Management?
For predictive analytics in supply chain management, a narrow pilot can often be delivered in 4–8 weeks if the data is accessible and the workflow is well defined. Production hardening usually takes 3–6 months because the real work includes pipeline reliability, governance, monitoring, user adoption, and system integration.
McKinsey’s research on planning technology is a reminder to stay disciplined here: 60% of planning IT implementations take longer, cost more, or miss expected outcomes.
What Data Do You Need First To Get Accurate Supply Chain Predictions?
Start with master data and event data before adding external signals. That means item, location, supplier, order, receipt, inventory movement, stockout, and lead-time history first. Promotions, pricing, holidays, weather, carrier events, or procedure schedules come next depending on the use case.
Should We Buy a Supply Chain Analytics Tool or Build a Custom Solution?
There is no universal answer. Buy when the use case is standard, your process is relatively mature, and the platform fits your source systems and workflow. Build when your decision logic is a differentiator, your data model is unusual, or you need tighter integration with ERP, WMS, TMS, or healthcare workflows.
A hybrid path is common: use a commercial foundation for data or planning workflows, then build the custom decision layer for predictive analytics in supply chain where your business needs more control.
How Do You Measure ROI for Predictive Analytics in Supply Chain Projects?
Track one operational KPI and one financial mechanism per use case. For example, lower forecast error should connect to fewer stockouts or less excess inventory. Lower lead-time variance should connect to lower safety stock or fewer expedites. APQC’s carrying-cost benchmark and McKinsey’s forecast and inventory improvement ranges are useful starting points for scenario models.
How Is Predictive Analytics in Healthcare Supply Chain Different From Retail or Manufacturing?
Predictive analytics in healthcare supply chain has a higher governance burden and a different risk profile. Clinical criticality, substitution limits, expirations, recalls, DSCSA traceability, and HIPAA boundaries all shape model design and workflow integration in ways that are usually less intense in retail or manufacturing.